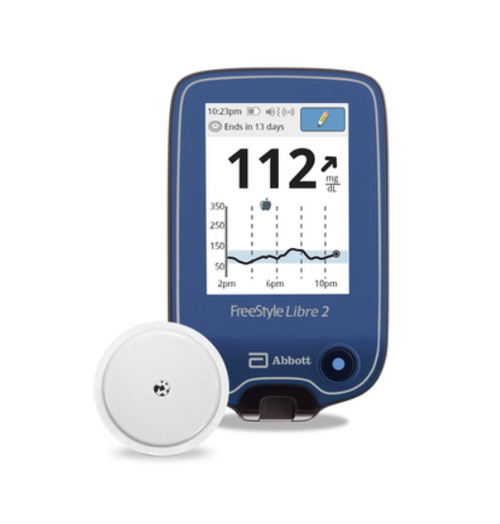
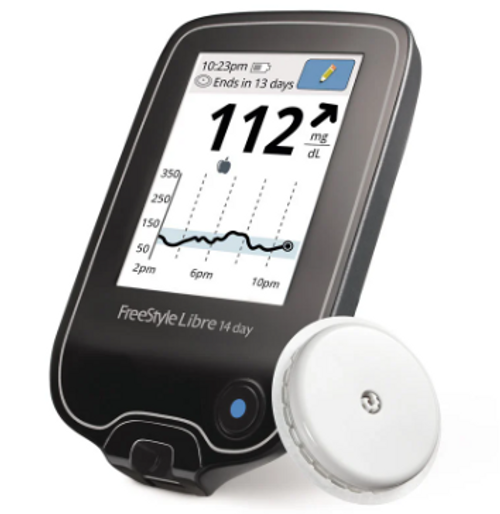
-Visual alerts and trend arrows Warn patients when their glucose is going high or low
-Daily Patterns Graph Helps patients assess glucose variability and identify periods when they are out of range
-Time in Target Chart Shows patients how often they are in target range
-Average Glucose Graph Indicates patients’ average glucose levels at various times of day
-Low Glucose Events Graph Reports the frequency of hypoglycemia events by time of day
-Helps patients track key factors impacting glucose throughout the day such as food, insulin, and exercise
-Unsurpassed 14 day accuracy for adults and children
-DOES NOT INCLUDE SENSOR
-This Reader is to be used with Libre 2 Sensors
- Shop
- |
- About Us
- |
- Blog
- |
- FAQ
- |
- Contact Us
- Fax:(475) 329-2563
- |
- Phone: 475-237-4088
- Diagnostics
- Aneroid Blood Pressure
- Auto-inflate Digital B.p Units
- B. P. Parts & Accessories
- Desk Chargers
- Microscope & Accessories
- Otoscope & Opthal. Batteries
- Otoscope Accessory
- Otoscope Heads
- Otoscope Specula
- Penlights
- Aneroid Blood Pressure
- Auto-Inflate Digital B.P units
- B. P. Parts & Accessories
- Comb. BP/Steth Sets
- Wrist Digital Blood Pressure
- Diapers & Briefs Products
- Incontinence
- Nebulizers & Accessories
- Compression Sleeves
- Stockings
- Commodes and Toilet Chairs
- Bath& Shower Chair/Accessories
- Cast/ Bandage Covers
- Grab Bars/Accessories
- Raised Toilet Seat
- Personal Protection Products
- Orthopedic Care
- Arm Sling/Shoulder Immobilizer
- Back Supports & Braces
- Elbow Supports
- Hernia Trusses
- Knee Supports & Braces
- Lymphedema Pumps & Garments
- Modular Seating
- Electrode Lotions & Gels
- Electrodes & Accessories
- Muscle Stimulators
- Tens Units
- Ultrasound Lotions, Gels, Accs
- Ultrasound Units & Accessories
- Burn Products
- CPR Barrier Masks
- CPR Masks & Accessories
- First Aid Kits
- Balance Training
- Body Fat Measures
- Bolster Rolls & Wedges
- Goniometers
- Measuring Aids
- Nerve/Sensory Evaluator & Access
- Pedometers
- Wax Baths & Refill Wax
- Arm/Leg Exercisers
- Cando Exercise Band
- Dumbell Weights
- Exercise Balls
- Exercise Tubing/Bands/Access
- Hand/Wrist Exercise Products
- Thera-Band Exercise Band
- Wrist & Ankle Cuffed Weights
- Bunion Bedder,Shield,Regulator
- Callous, Corn & Wart Removers
- Cam Walkers/ Foot Walkers
- Cast Boots
- Drop Foot Brace
- Hammer Toe Regulators
- Heel Cushions & Pads
- Insoles/Orthotics
- Metarsal Cushions & Pads
- Plantar Fasciitis Night Splint
- Post-Op Healing Shoes
- Surgical Shoes
- Toe Caps/Protectors/Cushions
- Toe Spreader & Separators
- Cold & Hot Therapy Packs
- Cold Therapy Packs
- Heating Pads/Accessories
- Hot and/or Cold Therapy Wraps
- Whirpools & Accessories
- Casting Supplies
- Impotence Device
- Analgesic Lotions/Sprays
- Foot Massagers/Rolls
- Heavy Duty Massagers
- Massage Creams & Lotions
- Specialty Massagers
- Breast Pumps
- Traction Kits & Accessories
- Medical Alert Accessories
- Internal Catheters & Guide Kit
- Male External Catheters
- Ankle Braces & Supports
- Arm Sling/Shoulder Immobilizer
- Back Supports & Braces
- Cervical Collars
- Golf-Tennis/ Elbow Supports
- Knee Supports &Braces
- Thumb Braces & Supports
- Wrist Braces & Supports
- Stockings
- CPAP Accessories
- CBD Products
- CBD Pain Creams & Gels
- Living Aids
- Rehabilitation
- Cane - Accessories
- Walker - Accessories
- Mobility Products


